
[ Spectroscopy] [ Photometry ]
![]()
Spectroscopy is the study of the interaction between light and matter. Its rich history can be traced all the way back to Issac Newton who observed light split through a prism into its component colors and decided that colors “are not qualifiations of light derived from Refractions, of Reflections of natural Bodies...but Originaland connate properties which in divers rays are divers.” In other words, Newton realized that the light “rays” producing each color were somehow different from each other: the “ray” that we see as violet, for example, is somehow intrinsically different from the “ray” that we perceive as red.
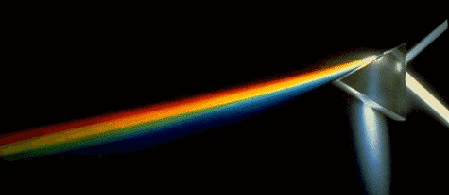 |
||
| Source: NASA |
We now know that these “rays” are actually massless particles that exhibit both wave and particle properties. Scientists call them photons. Different photons have different energies, and it turns out that violet photons are more energetic than red photons. Or, if we think about light as waves, violet light has a shorter wavelength than red light. Our eyes perceive this difference in energy or wavelength as a difference in color. Beyond red, there are even less energetic (even longer wavelength) infra-red photons that our eyes cannot see, but which we can feel as heat. Beyond violet, there are more energetic (even shorter wavelength) photons called ultra-violet. We again do not see these photons, but they may give us sunburns. The full spectrum of photon energies is called the Electromagnetic spectrum, and it runs from the lowest energy radio waves to the highest energy gamma rays.
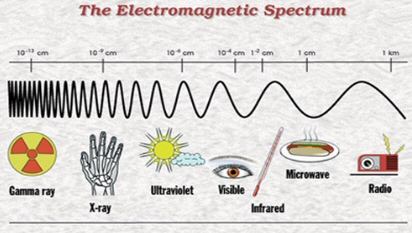 |
||
| Source: NASA |
![]()
In early 19 th century, Joseph von Fraunhofer, a German optician, was looking for a pure source of colored light to test the properties of various types of glass. When he looked at light from colored flames through his prisms, he noticed it did not split into the rainbow sunlight does, but rather into narrow colored lines. In particular, he noticed that all of his flames produced a bright double band in the yellowish region of the spectrum.
 |
||
Fraunhofer saw lines rather than full spectra when he split the light from his colored flames. In particular, he noticed all of his flames produced double yellow lines. |
Later, when Fraunhofer split sunlight through his prisms, he saw that its rainbow spectrum was not a smooth continuum, but was in actuality superimposed by many dark lines. Fraunhofer was interested to note that there were two particularly dark lines in the yellow-orange part of the spectrum coinciding with the bright yellow-orange lines he had seen in the flame spectra. He constructed a map of 576 lines in the Sun's spectrum, labeling the most prominent A-H. The double lines that coincided with the bright lines in the flame he labeled “D”. To this day, we call these lines “Fraunhofer lines.”
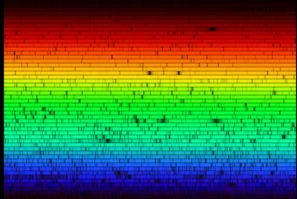 |
The Solar Spectrum Fraunhofer's “D” lines are visible just above the center of the image. |
|
| Source: National Optical Astronomy Observatory |
When Fraunhofer later observed the spectra of other stars, he saw that their spectral lines were different from those of the Sun. Fraunhofer concluded that the lines he was seeing therefore arose from properties of the stars themselves rather than the passage of their light through Earth's atmosphere.
In 1852, George Stokes noticed that when salt is thrown onto a flame, the flame becomes bright yellow and its spectrum consists entirely of the double yellow-orange D Fraunhofer lines. Stokes realized that it was the sodium creating these yellow lines and concluded that any given compound absorbs light (i.e. creates dark spectral lines) and emits light (i.e. creates bright spectral lines) at the same frequencies. In the case of sodium, it emits and absorbs at the frequencies of the D lines.
| Sodium Emission Lines |  |
Fraunhofer saw the D lines in all of his flame spectra because he was using a sodium flame. Today, low-pressure sodium lamps are sometimes used as outdoor streetlights – they are recognizable by the yellowish light they emit.
It was William Swan in 1857, however, who realized how useful these absorption and emission lines might be. He noted that a Bunsen flame turned bright yellow when he introduced only the tiniest grain of sodium into it and arrived at the realization that spectrum analysis, or spectroscopy, could provide a tool “of fantastic sensitivity” to detect the presence of various compounds. Because all compounds emit and absorb light at unique, specific frequencies, if an astronomer were to examine the spectrum of, say, a star like the Sun, and see that it has the double D lines, he or she could conclude that there is sodium in the atmosphere of that star. Astronomers can, in fact, infer the presence of any compound if they find its spectral signature. Spectroscopic lines are like the fingerprints of different atoms and molecules.
[ What Causes Spectral Lines? ]
[ How Do Astronomers Utilize Spectroscopy? ]
[ Can Spectroscopy Be Used To Detect Life? ]
[ Spectroscopy with New Worlds ]